
Health
Scientists are developing a visual aid to help people group foods based on their processing level
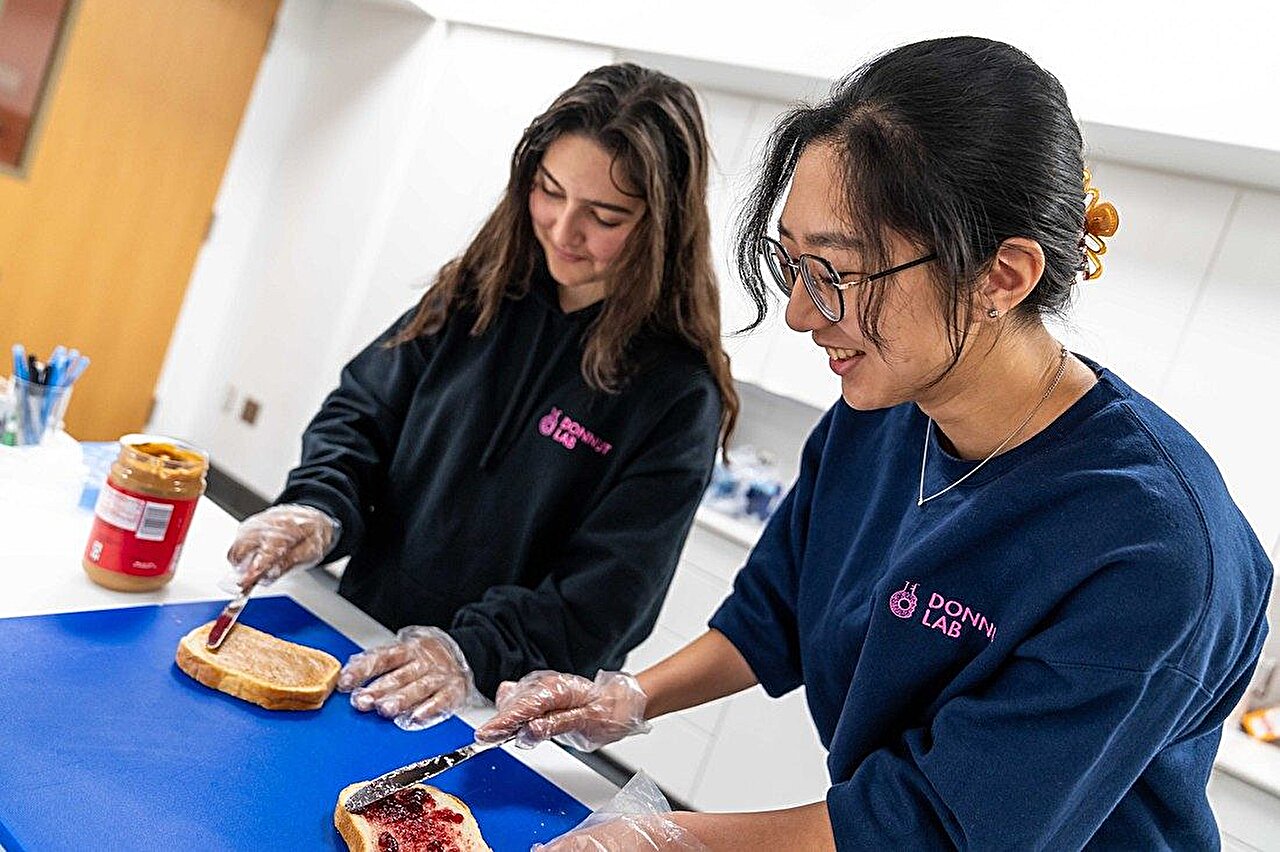
A Fralin Biomedical Research Institute study on minimally and ultra-processed foods in the journal Appetite gives scientists a new tool through composite photos of foods commonly consumed in the United States. Credit: Clayton Metz/Virginia Tech
Scientists at VTC’s Fralin Biomedical Research Institute who study ultra-processed foods have developed a new tool for assessing the rewarding and reinforcing properties of foods that make up 58% of the calories consumed in the United States. The foods have been linked to a wide range of negative health outcomes.
The study, which was published in the journal in April Pulloffers a collection of carefully curated images of minimally processed and ultra-processed foods, tailored to 26 attributes, including macronutrients, sodium, dietary fiber, calories, price, and visual attributes such as color and portion size.
The work was based on the NOVA classification system – ‘nova’ means new in Portuguese – which groups foods into four categories based on their level of processing. Nutrition researchers at the University of São Paulo in Brazil developed the scale while studying the country’s sharp rise in obesity rates.
The scale has its detractors.
“A major criticism of the NOVA scale is that it is difficult to use or that foods are classified differently by different people,” said Alexandra DiFeliceantonio, corresponding author and assistant professor at the Fralin Biomedical Research Institute. “We found that people with nutrition training generally agreed on food classifications, and provided data showing that this may not be a valid criticism.”
What they did
The NOVA system assigns foods to four categories: unprocessed or minimally processed, such as fresh fruit, legumes or yogurt; processed culinary ingredients, such as cooking oil, butter and salt; processed foods, which combine the two above with simple methods such as cheese, canned vegetables or freshly baked bread; and ultra-processed foods, such as soft drinks, flavored yogurts, processed meats and most packaged breads, made through industrial processing and additives rarely found in the home pantry.
To develop the image series, a team of psychologists, neuroscientists and registered dietitians selected foods that represent minimally processed or ultra-processed foods.
The food was prepared in a laboratory, visually displayed through professional photography and checked for consistency. Researchers also collected the price, food weight, and nutritional information (calories, macronutrients, sodium, and dietary fiber) for the food in each image.
Study participants rated images against a range of qualities to generate a final set of 28 images matched to 26 characteristics. To objectively measure the NOVA classification, researchers recruited 67 nutrition professionals and asked them to classify the foods as minimally or ultra-processed.
“With this set of food photos, we can conclude that any differences between food photos are due to the degree of food processing, and not all these other factors that we know have the potential to have an impact,” said Zach Hutelin, lead author of the study and a researcher . Fralin Biomedical Research Institute-based graduate student in translational biology, medicine and health Ph.D. program.
Why this matters
Ultra-processed foods are associated with an increased risk of developing obesity, type 2 diabetes, heart disease and cancer. They represent more than half of the calories consumed in the United States, Canada and the United Kingdom and have been identified as a global threat to public health.
“There is very little experimental research on ultra-processed foods, and part of what is holding us back is better tools for measuring and assessing their effects,” said DiFeliceantonio, who is also deputy director of the Center for Health Behaviors at Fralin Biomedical Research Institute. Research. “The more tools we can provide, the more we can learn.”
The Virginia Tech team makes the photos and associated data accessible through the Virginia Tech Data Repository from the Virginia Tech University Libraries. This allows scientists to test hypotheses in behavioral, economic, and neuroimaging studies.
In the DiFeliceantonio lab, the photos are used with functional MRI to reveal associated brain activity, with the images isolating the effects of food processing from other features.
More information:
Zach Hutelin et al., Creation and validation of a NOVA-scored photoset to evaluate ultra-processed foods., Pull (2024). DOI: 10.1016/j.appet.2024.107358
Quote: Scientists Develop a Visual Tool to Help People Group Foods by Their Level of Processing (2024, May 31) Retrieved June 1, 2024 from https://medicalxpress.com/news/2024-05-scientists-visual-tool- people-group .html
This document is copyrighted. Except for fair dealing purposes for the purpose of private study or research, no part may be reproduced without written permission. The content is provided for informational purposes only.


![[B-SIDE Podcast] The risks of using e-cigarettes and tobacco products, especially among young people](https://blogaid.org/wp-content/uploads/2024/07/B-SIDE-Podcast-The-risks-of-using-e-cigarettes-and-tobacco-products-300x240.jpg)
![[B-SIDE Podcast] The risks of using e-cigarettes and tobacco products, especially among young people](https://blogaid.org/wp-content/uploads/2024/07/B-SIDE-Podcast-The-risks-of-using-e-cigarettes-and-tobacco-products-80x80.jpg)